By Peter Kelley
Futurity
A digital project is using data visualization to depict social movements in United States history, including the NAACP, the American Socialist Party, and the Industrial Workers of the World.
For example, it’s one thing to read that the NAACP grew from three branches nationwide in 1912 to 894 branches in 1945, but it’s more interesting and revealing to watch that expansion—from Tacoma to Bangor, Maine, and beyond—on an interactive map, as the decades slide by.
The project, “Mapping American Social Movements through the 20th Century,” has the three-part goal of developing geographic data about social movements, producing visualizations such as interactive maps and charts, and providing analysis and interpretation of the data they present.
The maps are part of a growing group of websites overseen by James Gregory, professor of history at the University of Washington. Those resources are grouped as the Pacific Northwest Labor and Civil Rights Projects.
“Until now, historians and social scientists have mostly studied social movements in isolation and often with little attention to geography,” he says. “This project allows us to explore the relationships between social movements by bringing them together in time and space. It enables new understandings of how social movements interact, change and reproduce over time.”
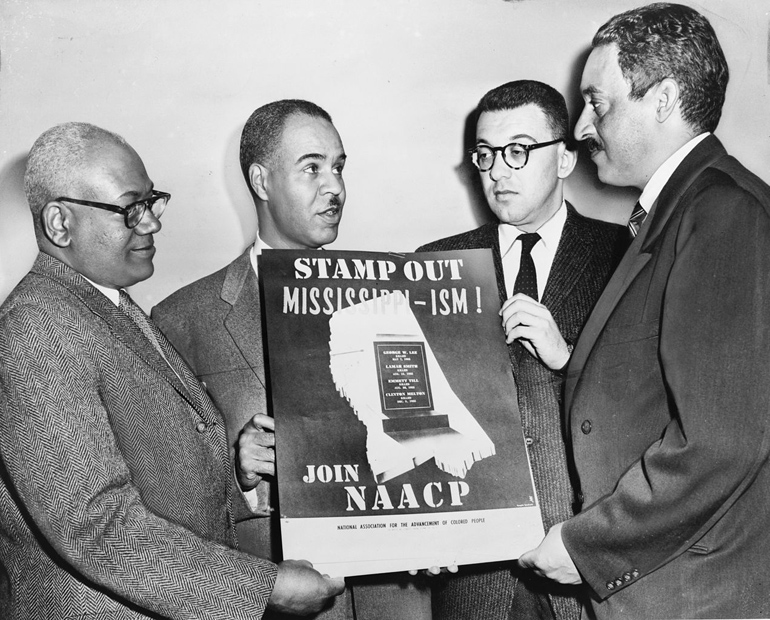
NAACP leaders hold a poster against racial bias in 1956. From left: Henry L. Moon, Roy Wilkins, Herbert Hill, Thurgood Marshall. (Credit: Al Ravenna/World Telegraph & Sun via Wikimedia Commons)
THE FRAGMENTED LEFT
Gregory is studying the historical role of radicalism in American politics—an issue, he says, that has long puzzled historians.
Much of what might be called radicalism grew through social movements rather than political parties, Gregory says. These movements have often been fragmented in nature, with civil rights, women’s rights, environmentalism, anti-war protest, and cultural issues all vying for public attention.
“This fragmentation makes the American left hard to define,” he says. Historical studies thus far have proved better at chronicling specific episodes of radicalism than explaining the movement as a whole. Historians, Gregory says, must “wrestle fully” with the fragmented nature of the American left to properly study the left as a movement.
“How has it met the challenge of endurance?” Gregory asks. “Movements seem to come and go. Radicalism seems to flourish for a time, and then dies back. Yet new lefts manage to appear later. How does that happen?”
KEY MOVEMENTS ON THE MAP
The dramatic rise of the NAACP is one of many progressive trends depicted on the Mapping Social Movements website. Here are a few others.
Maps of the American Socialist Party “reveal a geography of radicalism that has since disappeared,” Gregory says, with one map showing all of 353 towns and cities that elected Socialist mayors and other public officials in the years before World War I. A generation later those areas—such as Marshall County, Oklahoma, and Butler County, Ohio—had largely become conservative. “Nowadays, residents wouldn’t know what to think about their radical history,” Gregory says.
American voters seemed less concerned about the Communist Party before the Cold War that followed World War II. “By mapping the vote totals in each state and county for Communist candidates in elections from 1922 to 1944, we learn something about the numbers of party loyalists and where they lived,” Gregory says. This shows expected support in New York and Chicago, but, surprisingly, also strong Communist Party support in California in the late 1930s and early 1940s.
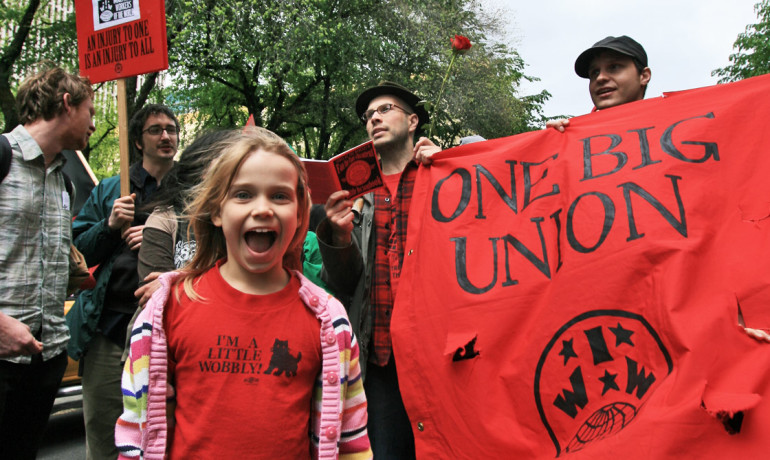
The project’s mapping of the Industrial Workers of the World, or IWW—also called “Wobblies”—is its most detailed yet. “The scope of the activity is one surprise,” Gregory says, with IWW unions found in more than 350 towns and cities across 38 states and territories as well as five Canadian provinces from 1905 to 1920, “but seeing the density of activity in Louisiana, Texas, Indiana, and Ohio is eye-opening.”
MAKING DATA PUBLIC
Additions coming soon to the site, Gregory says, are maps about the Congress of Racial Equality, or CORE, another important civil rights organization, and union activity by the United Farm Workers. Preliminary versions of the site have used the Tableau and Google Fusion platforms. Gregory says he’ll need additional technologies to create the more complex maps he wants, overlaying data in various arrangements.
Gregory intends this project to be collaborative. “As we move forward, I will be reaching out to social scientists who have developed very large datasets funded by the National Science Foundation and other federal agencies. Their data is supposed to be made public, and we offer a way to do that.”
In time, the digital project will become the basis for a set of articles and a digitally published book “that will explore the political geography of radical movements and reassess the ways they have interacted, regenerated themselves, and influenced political and cultural life during the 20th century.”
Grants from the Walter Chapin Simpson Center for the Humanities, the Lenore Hanauer Fund, the department of history, and the Harry Bridges Center for Labor Studies, all at the university, supported the project.
Source: University of Washington

