LatinaLista —
Election results tell us who we are while other statistics only hint at what we are
It was that premise that motivated Washington State University graduate student Ryne Rohla to undertake the massive task of compiling 2016 presidential voting data on a quest unlike any other before.
On his own time and dime, Ryne gathered 2016 presidential voting data from 175,000 precincts across the country. The economics student felt that just labeling a state ‘red’ or ‘blue’ did an injustice to the voters in that state and didn’t tell the whole story.
Ryne wanted to drill as deep as possible into the data to see not just what areas of the country voted for Trump and Clinton, but which neighborhoods. What he found has public policy organizations, economists and advocacy groups clamoring for his research.
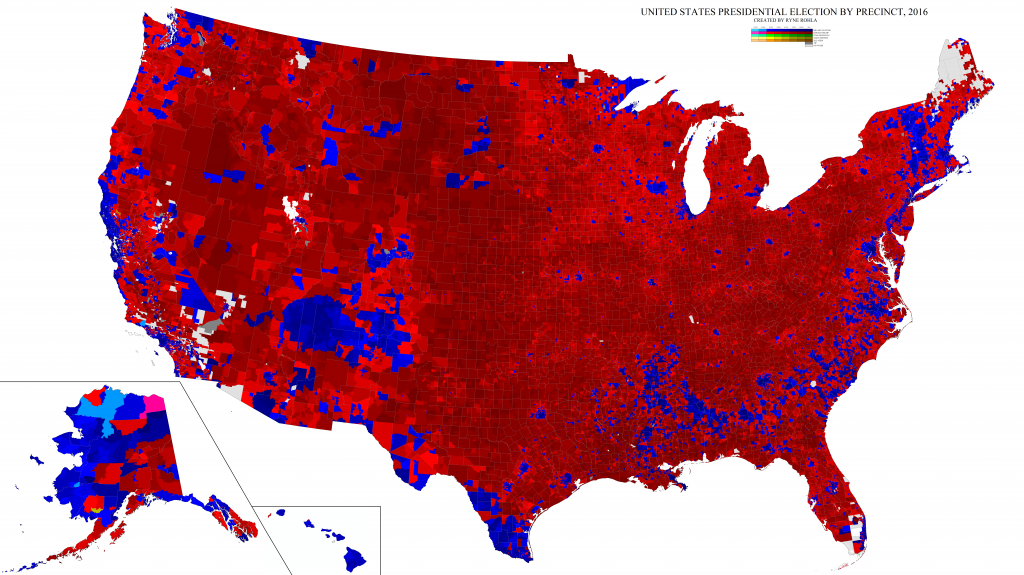
Ryne depicted his findings in three distinct national maps: a traditional national precinct map, a map depicting “approximate” swing voters, and a funky looking map (a cartograph), that at first glance looks more like an abstract painting, but depicts very real data and telling data.
In a blog post for Decision Desk HQ, Ryne shares background on his project and lets readers in on one of the principle findings of his research — the greatest factor that impacted voters’ decisions — education.
We’ll have to stay tuned to find out what promises to be more voter revelations and if Ryne’s findings can predict what party will win in 2020.